Key findings
- As the 2024 election comes into view, Rainey Center conducted survey research to understand how voters are thinking about election legitimacy, protest and election security policy.
- We find that while Americans remain deeply divided about the legitimacy of the 2020 election, they support a range of proposals to ensure elections are conducted in a fair, secure and speedy manner.
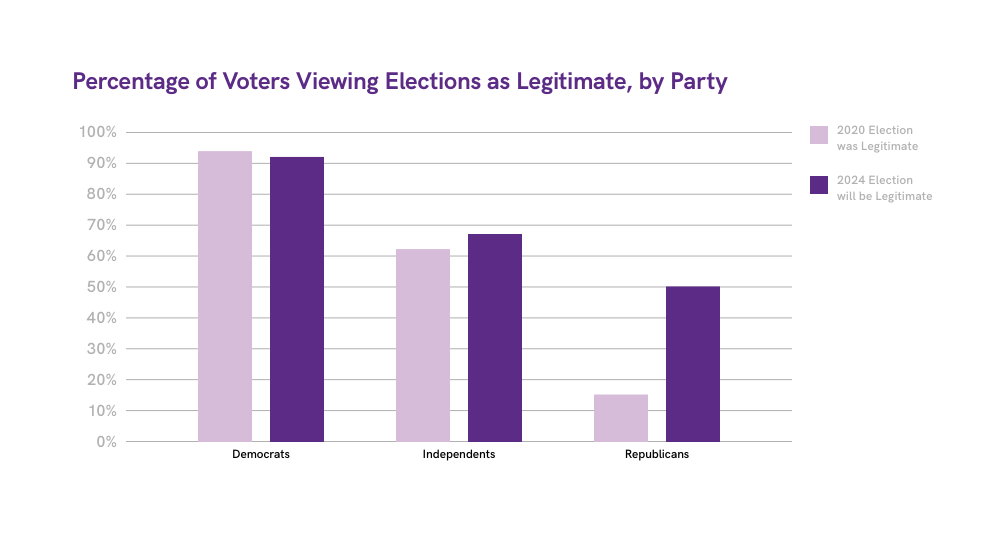
- Sixty percent of voters believe the 2020 election was legitimate, with views of the legitimacy of the 2020 election strongly correlated with partisanship.
- Ninety-four percent of Democratic voters believe the election was legitimate, compared with only 15% of Republican voters.
- Sixty-two percent of independent voters believe the 2020 election was legitimate.
As the 2024 election comes into view, Rainey Center conducted survey research to understand how voters are thinking about election legitimacy, protest and election security policy. We find that while Americans remain deeply divided about the legitimacy of the 2020 election, they support a range of proposals to ensure elections are conducted in a fair, secure and speedy manner. In addition, voters remain opposed to violent and dangerous protest tactics. Our findings should be a call to lawmakers to advance a bipartisan election security and legitimacy agenda.
Topline Findings
Election Legitimacy
Sixty percent of voters believe the 2020 election was legitimate, with views of the legitimacy of the 2020 election strongly correlated with partisanship. Ninety-four percent of Democratic voters believe the election was legitimate, compared with only 15% of Republican voters. Sixty-two percent of independent voters believe the 2020 election was legitimate.
Voters are more likely to believe the 2024 election will be legitimate, with 71% of voters saying they believe the 2024 election will be legitimate. Ninety-four percent of Democrats say that the 2024 election will be legitimate, as do 66% of independents and 50% of Republicans.
Political Activities
The political activities voters were most likely to have engaged in were talking to a friend about a cause that matters to them (42%), donating to a party, candidate or political organization (22%, 21%, 19% respectively), writing a letter to the editor (13%), volunteering for a political candidate (11%) and attending a protest or march (both 9%).
The largest gaps in political engagement were that Republicans were more likely to report talking to a friend about a political cause that mattered to them (9% more likely), while Democrats were more likely to have attended a protest (14%) or a march (12%).
Voters who consider the election illegitimate (mostly Republicans) are also more likely to disapprove of most protest tactics.
Political activities voters most viewed as legitimate were talking to a friend about a political cause that matters to them (83%), donating to a political party (81%), donating to a political organization (81%), donating to a political candidate for office (79%), and volunteering for a political candidate (80%).
Political activities voters least viewed as legitimate were threatening a judge (6%), sharing home addresses of a public political figure you disagree with (10%), blocking streets during a protest (15%), occupying a government building during a protest (16%), and protesting at someone’s home because they are a public political figure you disagree with (18%).
Policy Proposals
The policy proposals that garnered the strongest support were requiring states to use statistically sound methods for auditing votes to ensure elections are valid (79% support, 74% net support), requiring a specific chain of custody procedure for ballots and voting equipment to make tampering more difficult (79% support, 73% net support), and prohibiting foreign actors from spending money on U.S. elections (77% support, 70% net support).
The policy proposals most prioritized by voters were requiring a specific chain of custody procedure for ballots and voting equipment (40% selecting as top 3), requiring voter ID (39% selecting as top 3), and prohibiting foreign campaign spending (34% selecting as top 3).
The policy proposals most prioritized by Republicans were requiring voter ID (51% selecting as top 3), requiring a specific chain of custody procedure for ballots and voting equipment (35% selecting as top 3), and requiring states to maintain comprehensive, modern voter roll databases (34% selecting as top 3).
Election Legitimacy
The activity with the highest overall participation is talking to friends about a political cause (41%), though this is more common among Republicans (51%) than Democrats (42%). Democrats are substantially more likely than Republicans to say they have attended a protest (19% vs. 5%) or a march (15% vs. 3%) - a 14 percentage point and 12 percentage point gap, respectively.
Democrats are also more likely to say they have volunteered for a political candidate (15% vs. 8%) and written a letter to the editor (17% vs. 11%), with gaps of 7 and 6 points. For more confrontational tactics like occupying government buildings, blocking streets, protesting at homes, and threatening judges, participation is low overall and the partisan differences are smaller, generally 2-3 percentage points. The largest partisan gap is for talking to friends about a political cause, with Republicans 9 points more likely to do this than Democrats.
Overall, Democrats tend to report higher rates of engagement in traditional political activities like protests, marches, and volunteering, while Republicans are more likely to talk to friends about politics. But the differences are more muted for the most extreme, confrontational tactics, a welcome sign for our democracy.
| Political Activity | All | Dem | Rep | Dem - Rep |
|---|---|---|---|---|
| Talk to friends about a political cause that is important to you | 41% | 42% | 51% | -9% |
| Donate to a political party | 22% | 29% | 25% | 4% |
| Donate to a political candidate for office | 21% | 24% | 27% | -3% |
| Donate to a political organization | 19% | 24% | 20% | 4% |
| Attend a protest | 9% | 19% | 5% | 14% |
| Write a letter to the editor | 13% | 17% | 11% | 6% |
| Attend a march | 9% | 15% | 3% | 12% |
| Volunteer for a political candidate | 11% | 15% | 8% | 7% |
| Confront someone in public because they are a public political figure you disagree with | 3% | 5% | 2% | 3% |
| Occupy a government building during a protest | 2% | 3% | 3% | 0% |
| Block streets during a protest | 2% | 4% | 2% | 2% |
| Protest at someone's home because they are a public political figure you disagree with | 1% | 3% | 1% | 2% |
| Share home addresses of a public political figure you disagree with | 3% | 3% | 2% | 1% |
| Threaten a judge | 2% | 2% | 2% | 0% |
Source: page 7
Our survey finds a clear hierarchy in the public’s views on the legitimacy of various political protest tactics. Large majorities see conventional activities like talking to friends about political causes (83%), donating to parties and candidates (79-81%), and volunteering for campaigns (80%) as legitimate forms of political expression.
Attending marches (75%) and protests (70%) are also viewed as legitimate by most respondents. However, more confrontational tactics like confronting public figures in public (29%), defying court rulings (20%), protesting at homes (18%), and occupying government buildings (16%) are seen as legitimate by only small minorities.
The most extreme actions, such as blocking streets (15%), sharing home addresses (10%), and threatening judges (6%), are overwhelmingly viewed as illegitimate by the public. This suggests a clear dividing line, where conventional political participation is widely accepted, but disruptive or potentially violent tactics are strongly rejected as legitimate forms of political expression.
The public appears to draw a firm distinction between peaceful, lawful political activities and more aggressive, confrontational ones that could infringe on the rights of others or undermine democratic institutions. This pattern holds across party lines, a welcome sign for the health of our democracy.
| Political Activity | View as Legitimate |
|---|---|
| Talk to friends about a political cause that is important to you | 83% |
| Donate to a political party | 81% |
| Donate to a political candidate for office | 79% |
| Donate to a political organization | 81% |
| Volunteer for a political candidate | 80% |
| Write a letter to the editor | 80% |
| Attend a march | 75% |
| Attend a protest | 70% |
| Confront someone in public because they are a public political figure you disagree with | 29% |
| State defy court ruling a public political figure you disagree with | 20% |
| Protest at someone’s home because they are a public political figure you disagree with | 18% |
| Occupy a government building during a protest | 16% |
| Block streets during a protest | 15% |
| Share home addresses of a public political figure you disagree with | 10% |
| Threaten a judge | 6% |
Source: page 8
The data shows a clear divide in views on the legitimacy of different political protest tactics based on whether someone believes the 2020 election was legitimate or not.
Across the board, those who see the 2020 election as legitimate are significantly more likely to view various protest activities as legitimate forms of political expression. The biggest gaps are for attending protests (+26 percentage points) and marches (+19 points), where election legitimacy believers are much more accepting.
There are also substantial differences for other confrontational tactics like blocking streets (+15 points), confronting public figures (+7 points), and protesting at homes (+7 points). Election legitimacy believers are more permissive of these actions compared to those who see the 2020 election as illegitimate, indicating a correlation between overall belief in the accuracy of election results and belief in the efficacy and appropriateness of protest tactics.
The only exceptions are for state governments defying court rulings (-7 points) and sharing home addresses (-4 points), which 2020 election deniers are slightly more likely to view as legitimate. The difference in states obeying court rulings is particularly relevant in the context of post-election disputes and litigation. But for the most extreme tactic, threatening judges, there is no difference between the two groups.
This suggests a strong correlation between views on electoral integrity and attitudes towards protest activity. Those who trust the democratic process are far more accepting of conventional and even disruptive forms of political expression, while 2020 election deniers draw the line at such tactics much more narrowly.
| Political Activity | All | Legit. | Not Legit. | Dif. |
|---|---|---|---|---|
| Talk to friends about a political cause that is important to you | 83% | 85% | 79% | 6 |
| Donate to a political party | 81% | 83% | 77% | 6 |
| Donate to a political organization | 81% | 85% | 74% | 11 |
| Donate to a political candidate for office | 79% | 83% | 74% | 9 |
| Volunteer for a political candidate | 80% | 86% | 72% | 14 |
| Write a letter to the editor | 80% | 82% | 76% | 6 |
| Attend a march | 75% | 83% | 64% | 19 |
| Attend a protest | 70% | 81% | 55% | 26 |
Source: page 9
| Political Activity | All | Legit. | Not Legit. | Dif. |
|---|---|---|---|---|
| Confront someone in public because they are a public political figure you disagree with | 29% | 32% | 25% | 7 |
| State defy court ruling a public political figure you disagree with | 20% | 17% | 24% | -7 |
| Protest at someone’s home because they are a public political figure you disagree with | 18% | 21% | 14% | 7 |
| Occupy a government building during a protest | 16% | 18% | 13% | 5 |
| Block streets during a protest | 15% | 21% | 6% | 15 |
| Share home addresses of a public political figure you disagree with | 10% | 8% | 12% | -4 |
| Threaten a judge | 6% | 6% | 6% | 0 |
Source: page 10
The data shows a similar pattern when looking at whether people have engaged in or would consider engaging in these various protest tactics, based on their views of the 2020 election’s legitimacy.
Those who see the 2020 election as legitimate are significantly more likely to say they have or would participate in many of these activities compared to those who view the election as illegitimate. The largest gaps are for attending protests (+26 percentage points) and marches (+27 points) - election legitimacy believers are much more willing to take part in these forms of political expression.
There are also considerable differences for more confrontational tactics like blocking streets (+11 points), confronting public figures (+9 points), and occupying government buildings (+7 points). Election legitimacy believers report higher rates of engagement or willingness to engage in these actions.
The disparities are smaller but still present for activities like donating to parties, candidates, and organizations (gaps of 6-11 points), as well as writing letters to the editor (+7 points) and protesting at homes (+6 points).
The only areas where the differences are negligible are talking to friends about political causes (+2 points) and threatening judges (+2 points), which have very low reported participation overall. This data reinforces the finding that trust in the electoral system is strongly correlated with people’s likelihood to participate in various forms of political activism, both conventional and confrontational. Those who doubt election integrity appear to be more reluctant to engage in these activities compared to those who have faith in the democratic process.
The potential for these divergent attitudes to contribute to further political polarization and conflict is concerning. The data suggests a divide not just in beliefs, but in concrete political behaviors as well.
| Protest Tactic | All | Legit. | Not Legit. | Dif. |
|---|---|---|---|---|
| Talk to friends about a political cause that is important to you | 79% | 80% | 78% | 2 |
| Donate to a political party | 61% | 63% | 57% | 6 |
| Donate to a political organization | 60% | 64% | 53% | 11 |
| Donate to a political candidate for office | 61% | 64% | 55% | 9 |
| Volunteer for a political candidate | 56% | 60% | 50% | 10 |
| Write a letter to the editor | 63% | 66% | 59% | 7 |
| Attend a march | 50% | 61% | 34% | 27 |
| Attend a protest | 50% | 61% | 35% | 26 |
| Confront someone in public because they are a public political figure you disagree with | 31% | 35% | 26% | 9 |
| Protest at someone’s home because they are a public political figure you disagree with | 15% | 18% | 12% | 6 |
| Occupy a government building during a protest | 18% | 21% | 14% | 7 |
| Block streets during a protest | 16% | 21% | 10% | 11 |
| Share home addresses of a public political figure you disagree with | 14% | 16% | 10% | 6 |
| Threaten a judge | 8% | 9% | 7% | 2 |
Source: page 11
Policy Proposals
Policy Support
In our poll, we tested a number of proposals covered in our recent reports on fair and fast elections. We find that voters strongly support proposals that would make the election system more secure, modern and quickly report results on election night.
The top proposals focus on modernizing voter registration systems (80% support), securing the vote counting process (79% support for statistically sound audits), maintaining control over ballots and election infrastructure (79% support for chain of custody protocols), ensuring timely reporting of absentee votes (78% support), and preventing foreign interference (77% support).
Other proposals with strong majority support include requiring up-to-date information for absentee voters (76% support), mandating that election software be made in America (73% support), and requiring voter ID (74% support).
The proposal with the most opposition is requiring paper ballots for recounts, at 14%. However, this is still outweighed by 68% supporting the measure.
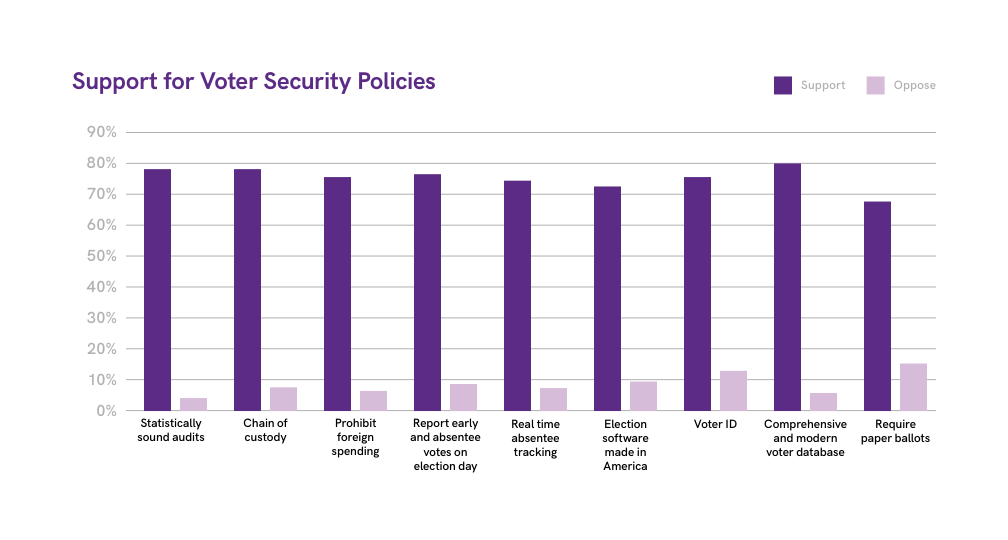
Overall, the data shows robust public support for a range of election security measures aimed at increasing transparency, tightening controls, and safeguarding against potential vulnerabilities. The high levels of support and low opposition suggest voters across the political spectrum see securing election integrity as an important priority.
There is some variation in the intensity of support, with more technical proposals like auditing procedures and absentee voter tracking receiving slightly lower support than broader measures like improving voter databases and securing the physical voting process. The chart below shows support for different voter security policies, due to space limitations, the full policy descriptions are available in the appendix and the chart displays a shortened description of the proposal.
Policy Prioritization
Our poll finds that voters prioritize chains of custody (40% selecting this as a top 3 priority), voter identification laws (39%). and prohibiting foreign actors from intervening in elections (34%).
Other proposals that a sizable share of voters see as high priorities include requiring the use of paper ballots for recounts (29%), maintaining comprehensive voter roll databases (26%), and ensuring mail-in/absentee ballots are counted in a timely manner (23%).
Proposals focused on auditing votes to prevent incorrect election certifications (19%) and requiring absentee voter information to be up-to-date (22%) were seen as less urgent priorities by voters overall, though they still garnered support from a significant minority.
This data suggests that voters place a premium on process-oriented measures to secure the integrity of the electoral system, such as chain of custody protocols, voter ID requirements, and limiting foreign interference. Bread-and-butter issues like recounts and voter roll maintenance are also seen as high priorities.
In contrast, more technical or behind-the-scenes proposals around auditing and absentee voter data, while important, seem to be viewed as less immediately crucial by most voters. This likely reflects a desire for visible, tangible steps to safeguard elections.
Overall, the findings point to the salience of election security as a key concern for the voting public, with substantial support for a range of proposals to address perceived vulnerabilities in the system.
| Proposal | Selected as Top 3 |
|---|---|
| Requiring a specific chain of custody and procedure to be followed for ballots, voting machines, election records, and voter rolls, so that tampering with the process is more difficult | 40% |
| Ensuring that states require up to date valid identification of each voter before their vote is counted | 39% |
| Making sure that foreign actors, including governments, corporations, and individuals are prohibited from spending money on elections in America | 34% |
| Requiring the use of a paper ballot so that every vote can be counted in the event that a recount is necessary | 29% |
| Requiring states to maintain comprehensive and modern databases of their voter rolls so that it is easy to identify who is allowed to vote | 26% |
| Requiring all ballot counting machines and software to be made in America | 25% |
| Ensuring mail in and absentee ballots that have been sent in early are counted in time to reach a final verdict on election day | 23% |
| Requiring up to date information for all absentee voters so that there can be no question as to whether or not an absentee ballot is genuine | 22% |
| Requiring states to use statistically sound methods for auditing votes when ensuring elections are valid so that no election can be certified incorrectly | 19% |
Source: page 15
Republicans
Given that Republicans are especially concerned about electoral legitimacy, we analyzed their top election security priorities. The data reveals some notable differences in the election security priorities of Republican voters compared to the overall electorate.
The most striking divergence is on the issue of voter ID. A majority of Republicans (51%) select requiring up-to-date voter identification as one of their top three priorities, significantly higher than the 39% of all voters who do so.
Republicans also place greater emphasis on maintaining comprehensive, modern voter databases (34% prioritizing vs. 26% overall) and requiring paper ballots for recounts (33% vs. 29% overall). This points to a stronger focus among Republicans on measures to control voter rolls and ensure the physical security of ballots.
On the other hand, Republicans are somewhat less likely than the general public to prioritize prohibiting foreign election spending (27% vs. 34% overall) and ensuring timely counting of early/absentee votes (20% vs. 23% overall). While still important to a significant minority of Republicans, these issues appear to be slightly less urgent compared to other priorities.
Republicans prioritize a distinct set of election reforms centered on tightening voter eligibility rules, securing physical ballots and voting equipment, and maintaining strict control over voter registration.
| Proposal | Selected as Top 3 |
|---|---|
| Ensuring that states require up to date valid identification of each voter before their vote is counted | 51% |
| Requiring a specific chain of custody and procedure to be followed for ballots, voting machines, election records, and voter rolls, so that tampering with the process is more difficult | 35% |
| Requiring states to maintain comprehensive and modern databases of their voter rolls so that it is easy to identify who is allowed to vote | 34% |
| Requiring the use of a paper ballot so that every vote can be counted in the event that a recount is necessary | 33% |
| Making sure that foreign actors, including governments, corporations, and individuals are prohibited from spending money on elections in America | 27% |
| Requiring up to date information for all absentee voters so that there can be no question as to whether or not an absentee ballot is genuine | 26% |
| Requiring all ballot counting machines and software to be made in America | 26% |
| Ensuring mail in and absentee ballots that have been sent in early are counted in time to reach a final verdict on election day | 20% |
| Requiring states to use statistically sound methods for auditing votes when ensuring elections are valid so that no election can be certified incorrectly | 13% |
Source: page 17
Belief in 2020 Election
The table below shows the prioritization of election security proposals, broken down by belief that the 2020 election was legitimate.
The proposal with the biggest gap in priority between those who believe the 2020 election was legitimate vs. not legitimate is requiring voter ID. Forty-eight percent of those who think the election was not legitimate select this as a top 3 priority, compared to 33% of those who think it was legitimate - a 15 point gap. The proposal with the next largest gap is requiring statistically sound auditing methods, which is 9 points higher as a priority for those who think the election was legitimate (23% vs. 14%).
Two proposals - requiring a specific chain of custody procedure and requiring up-to-date absentee voter information - are prioritized at nearly identical rates regardless of 2020 election views. For most other proposals, those who think the 2020 election was legitimate are slightly more likely to prioritize them, but the gaps are relatively small (4-5 points).
Belief in the legitimacy of the 2020 election has the biggest impact on the prioritization of voter ID laws and statistically sound auditing. But for most proposals, the differences in priority based on 2020 election views are relatively modest.
| Proposal | Legit. | Not Legit. |
|---|---|---|
| Ensuring mail in and absentee ballots that have been sent in early are counted in time to reach a final verdict on election day | 25% | 21% |
| Making sure that foreign actors, including governments, corporations, and individuals are prohibited from spending money on elections in America | 36% | 31% |
| Requiring all ballot counting machines and software to be made in America | 26% | 24% |
| Requiring states to maintain comprehensive and modern databases of their voter rolls so that it is easy to identify who is allowed to vote | 27% | 25% |
| Ensuring that states require up to date valid identification of each voter before their vote is counted | 33% | 48% |
| Requiring the use of a paper ballot so that every vote can be counted in the event that a recount is necessary | 31% | 26% |
| Requiring states to use statistically sound methods for auditing votes when ensuring elections are valid so that no election can be certified incorrectly | 23% | 14% |
| Requiring up to date information for all absentee voters so that there can be no question as to whether or not an absentee ballot is genuine | 22% | 22% |
| Requiring a specific chain of custody and procedure to be followed for ballots, voting machines, election records, and voter rolls, so that tampering with the process is more difficult | 41% | 40% |
Source: page 19
Conclusion
While American voters remain divided about the legitimacy of the 2020 election, with a large majority of Republicans rejecting the results, we find strong bipartisan support for policies to secure American elections.
Appendix
| Proposal | Short Code |
|---|---|
| Requiring states to use statistically sound methods for auditing votes when ensuring elections are valid so that no election can be certified incorrectly | Statistically sound audits |
| Requiring a specific chain of custody and procedure to be followed for ballots, voting machines, election records, and voter rolls, so that tampering with the process is more difficult | Chain of custody |
| Making sure that foreign actors, including governments, corporations, and individuals are prohibited from spending money on elections in America | Prohibit foreign spending |
| Ensuring mail in and absentee ballots that have been sent in early are counted in time to reach a final verdict on election day | Report early and absentee votes on election day |
| Requiring up to date information for all absentee voters so that there can be no question as to whether or not an absentee ballot is genuine | Real time absentee tracking |
| Requiring all ballot counting machines and software to be made in America | Election software made in America |
| Ensuring that states require up to date valid identification of each voter before their vote is counted | Voter ID |
| Requiring states to maintain comprehensive and modern databases of their voter rolls so that it is easy to identify who is allowed to vote | Comprehensive and modern voter database |
| Requiring the use of a paper ballot so that every vote can be counted in the event that a recount is necessary | Require paper ballots |
Source: page 21
Methodology
Rainey Center conducted a survey online with a sample of 1,114 respondents fielded over web panels from March 25 to March 26 and weighted respondents to reflect the national voting population on education, gender, race, survey engagement, and 2020 election results. The margin of error is +/- 5.1